NanoVNA Saver
NanoVNA Saver is a versatile, multiplatform application developed by Rune B. Broberg. It connects to your NanoVNA to extract, display, and analyze measurement data directly on your computer. A key advantage of this software is its ability to bypass the 101-point hardware display limit by sweeping frequency spans in multiple segments, allowing for incredibly detailed, high-resolution measurements.
Written in Python, the software leverages PyQt, NumPy, SciPy, and PySerial to deliver a rich analysis environment that runs seamlessly natively across Windows, macOS, and Linux.
Key Features:
- Extracting and reading data seamlessly from NanoVNA V1 and V2 series devices.
- Splitting frequency ranges into multiple segments to dramatically increase resolution (up to >10,000 points).
- Averaging sweep data to reduce noise, which is particularly beneficial at higher frequencies.
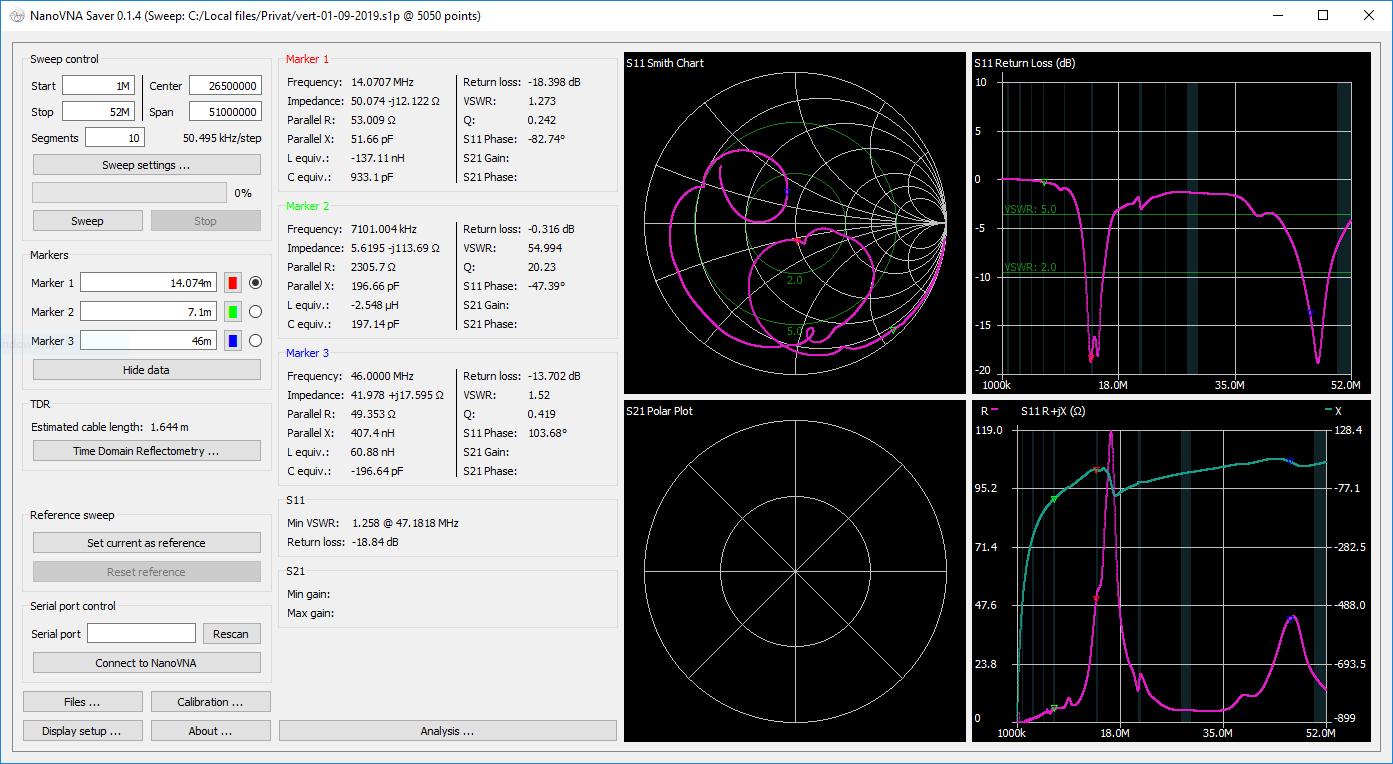
- Visualizing data across various chart types, including Smith, LogMag, Phase, and VSWR charts for S11 and S21.
- Providing robust markers with direct readouts for impedance, VSWR, Q-factor, and equivalent capacitance/inductance.
- Overlaying customizable reference bands (such as amateur radio bands) onto frequency sweeps.
- Exporting and importing 1-port and 2-port Touchstone (.s1p, .s2p) files.
- Advanced Time Domain Reflectometry (TDR) for measuring cable length and impedance.
- Detailed filter analysis tools for low-pass, high-pass, band-pass, and band-stop filters.
- Displaying both a live active trace and a saved reference trace for easy comparisons.
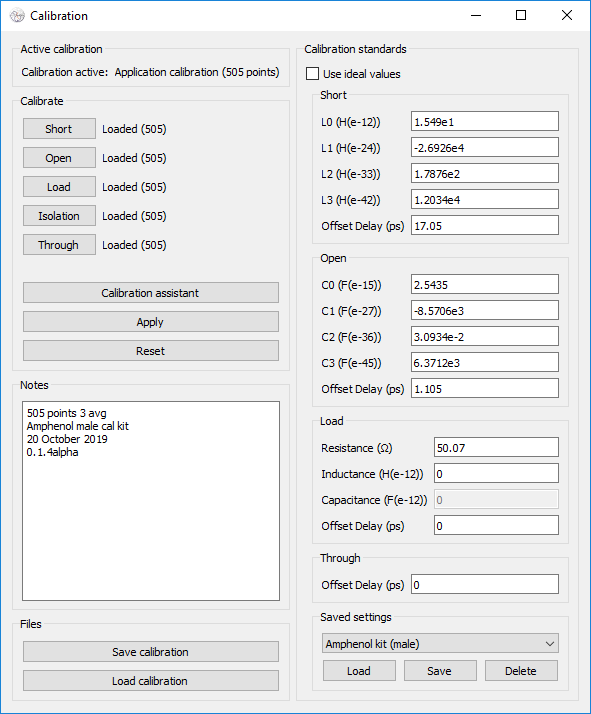
- Performing in-application calibration, including compensation for non-ideal standards.
- Customizing the user interface with distinct colors and a "dark mode".
- Exporting high-quality images of plotted graphs.
Screenshots:
Windows 7 Requirements:
Download NanoVNA Saver v0.6.2
Windows 64-bit (.zip) Linux ExecutableNew in v0.6.2
- PyQt6 fixes
- Add option --auto-connect, connect automatically if one device detected
- Correct some inconsistencies in the UI
- 3rd party library updates
Older versions
Downloads are also available directly from GitHub.
Using NanoVNA Saver
Below is a quick guide on how to configure and retrieve data using the NanoVNA Saver software.
1. Connecting to your device
Connect your NanoVNA to your computer via a data-capable USB cable. The device should appear as a serial port. Enter or select this serial port from the designated drop-down menu. If the NanoVNA was plugged in before starting the application, it usually detects it automatically. If not, click "Rescan", then click "Connect to device" to establish communication.
2. Sweeps and segments
To overcome hardware point limits and acquire highly detailed measurements, the app strings multiple sweep segments together. Enter the desired number of segments in the "Segments" box. Each segment captures 101 data points and takes approximately 1.5 seconds to complete. Thus, increasing segments yields better resolution but increases sweep time.
You can enter frequency ranges in standard Hz or use convenient suffixes like k and M (e.g., 144M). Scientific notation, such as 6.5e6 for 6.5 MHz, is also supported.
3. Markers & display options
Markers allow you to pinpoint exact values along your measurement graphs. You can input them manually or control them with your mouse. Hold "Shift" while clicking a graph to drag the nearest marker to your cursor's location. The marker readout boxes show precisely calculated values at those frequencies; these can be toggled off via the "hide data" button if they visually clutter the screen.
To personalize your workspace, access the "Display setup". Here, you can adjust chart colors, alter font sizes, and choose which graphs are visible. Your preferences are saved automatically across sessions.
4. In-app calibration
Before launching your first sweep in NanoVNA Saver, we highly recommend ensuring your device has a basic, full-span calibration saved to slot 0 natively on the hardware. Uncalibrated devices might output raw readings that fall outside the application's accepted display range.
For fine-tuned accuracy, NanoVNA Saver includes a robust Calibration Assistant. You can sweep your Open, Short, Load, and Thru standards right from your computer. Simply click the respective buttons in the calibration window. You can also define custom calibration standards, add descriptive notes to your profile, and save or load these profiles for future use. After clicking Apply, the calibration is immediately factored into your active data.
Note: Load capacitance compensation is currently unsupported.
5. Advanced tools (TDR & core permeability)
Time Domain Reflectometry (TDR): For accurate cable length measurements, first run a proper calibration, then attach the cable exactly at the calibration plane (where the standard Load would typically be connected). Open the Time Domain Reflectometry window and select your specific cable type from the list, or manually enter its propagation velocity factor.
Measuring Inductor Core Permeability: The permeability (µ) of magnetic cores can be determined using a standard 1-port measurement. Wind a wire around a core of known dimensions and open the "S11 mu" plot located in the Display Setup. Right-click the plot to enter the core's parameters - cross-sectional area (mm²), effective length (mm), and number of windings - to see accurate permeability calculations.