Saud Aldhafyan 2026/03/20 20:34
Dear Jeremy,
Please find the attached article
clc;
clear;
% ===== Constants =====
c = 3e8; % Speed of light (m/s)
d = 2.62e-3; % Thickness in meters (example: 2.62 mm)
% ------------------- Ask user to select Excel file -------------------
[filename, pathname] = uigetfile('*.xlsx', 'Select your S-parameter Excel
file');
if isequal(filename,0)
error('No file selected. Exiting...');
end
filepath = fullfile(pathname, filename);
% ===== Read data from Excel =====
% Make sure your Excel file has columns: frequency(Hz), e', e'', u', u''
data = readmatrix(filepath); % Reads all numeric data
f = data(:,1); % Frequency in Hz
ep_real = data(:,2); % e'
ep_imag = data(:,3); % e''
mu_real = data(:,4); % u'
mu_imag = data(:,5); % u''
% ===== Complex parameters =====
eps_r = ep_real - 1i*ep_imag;
mu_r = mu_real - 1i*mu_imag;
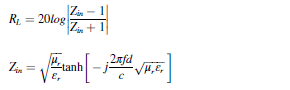
% ===== Input impedance calculation =====
Zin = sqrt(mu_r ./ eps_r) .* tanh(-1i .* (2*pi.*f.*d./c) .* sqrt(mu_r .*
eps_r));
% ===== Reflection Loss =====
RL = 20*log10(abs((Zin - 1) ./ (Zin + 1)));
% ===== Reflection coefficient =====
Gamma = abs((Zin - 1) ./ (Zin + 1));
% ===== Absorption percentage =====
Absorption = (1 - Gamma.^2) * 100;
% ===== Display results =====
Result = table(f, RL, Absorption)
% ===== Plot RL =====
figure
plot(f/1e9, RL,'LineWidth',2)
xlabel('Frequency (GHz)')
ylabel('Reflection Loss (dB)')
title('Reflection Loss vs Frequency')
grid on
On Fri, 20 Mar 2026 at 8:11 PM JRW via groups.io <wallerjr=
bigpond.com@groups.io> wrote:
> Hi Saud,
>
> 1. Please post a copy of your xl/csv file. I can write a function to
> evaluate those equations and plot the result to check what you have
> published.
>
> 2. Can you post a picture of your plot.
>
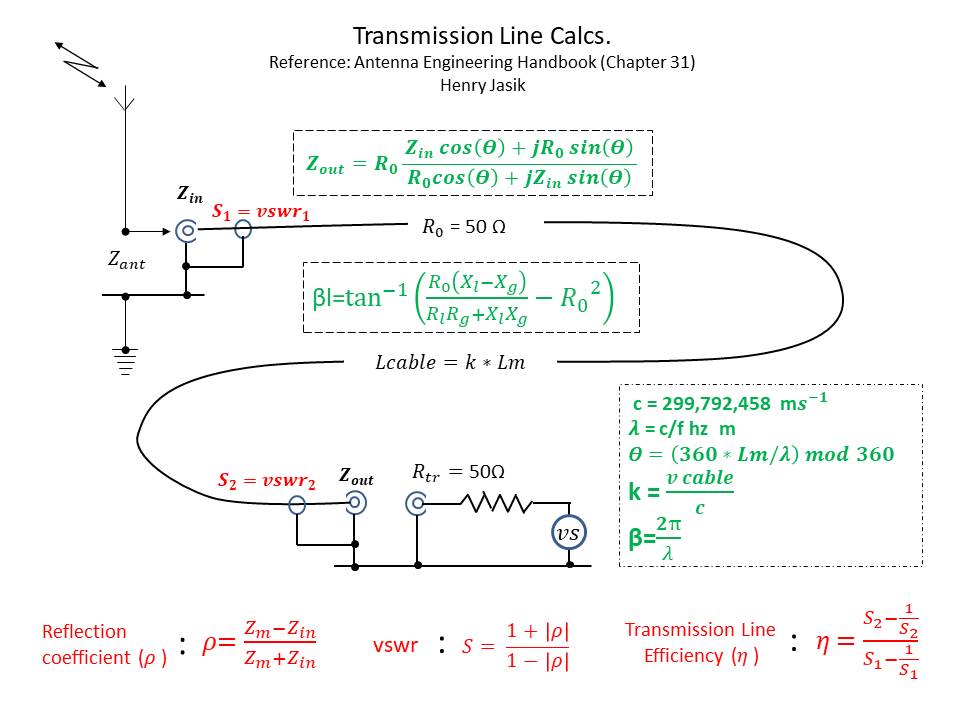
> 3. Please provide a reference from where you obtained your 2 equations.
> Attached is a picture, on transmission lines, from my record.
>
> 4. Please write your code as a MATLAB function.
>
> Regards,
>
> Jeremy.
> On 17/03/2026 18:28, Saud Aldhafyan via groups.io wrote:
>
>
>
>
>
> The image contains the Transmission Line (TRL) equation. I am trying to
> develop a MATLAB code that matches this equation accurately. However, I
> need to verify that the implementation is consistent with the mathematical
> expression shown in the image.
>
> Could you please review it and help ensure that the MATLAB code correctly
> follows the TRL equation?
>
>
>
>
>
> Here this matlab code
>
>
> clc;
> clear;
> % ===== Constants =====
> c = 3e8; % Speed of light (m/s)
> d = 2.62e-3; % Thickness in meters (example: 2.62 mm)
> % ------------------- Ask user to select Excel file -------------------
> [filename, pathname] = uigetfile('*.xlsx', 'Select your S-parameter Excel
> file');
> if isequal(filename,0)
> error('No file selected. Exiting...');
> end
> filepath = fullfile(pathname, filename);
> % ===== Read data from Excel =====
> % Make sure your Excel file has columns: frequency(Hz), e', e'', u', u''
> data = readmatrix(filepath); % Reads all numeric data
> f = data(:,1); % Frequency in Hz
> ep_real = data(:,2); % e'
> ep_imag = data(:,3); % e''
> mu_real = data(:,4); % u'
> mu_imag = data(:,5); % u''
> % ===== Complex parameters =====
> eps_r = ep_real - 1i*ep_imag;
> mu_r = mu_real - 1i*mu_imag;
> % ===== Input impedance calculation =====
> Zin = sqrt(mu_r ./ eps_r) .* tanh(-1i .* (2*pi.*f.*d./c) .* sqrt(mu_r .*
> eps_r));
> % ===== Reflection Loss =====
> RL = 20*log10(abs((Zin - 1) ./ (Zin + 1)));
> % ===== Reflection coefficient =====
> Gamma = abs((Zin - 1) ./ (Zin + 1));
> % ===== Absorption percentage =====
> Absorption = (1 - Gamma.^2) * 100;
> % ===== Display results =====
> Result = table(f, RL, Absorption)
> % ===== Plot RL =====
> figure
> plot(f/1e9, RL,'LineWidth',2)
> xlabel('Frequency (GHz)')
> ylabel('Reflection Loss (dB)')
> title('Reflection Loss vs Frequency')
> grid on
>
>
>
>
