
Karam 2024/07/01 08:04
Hi ,
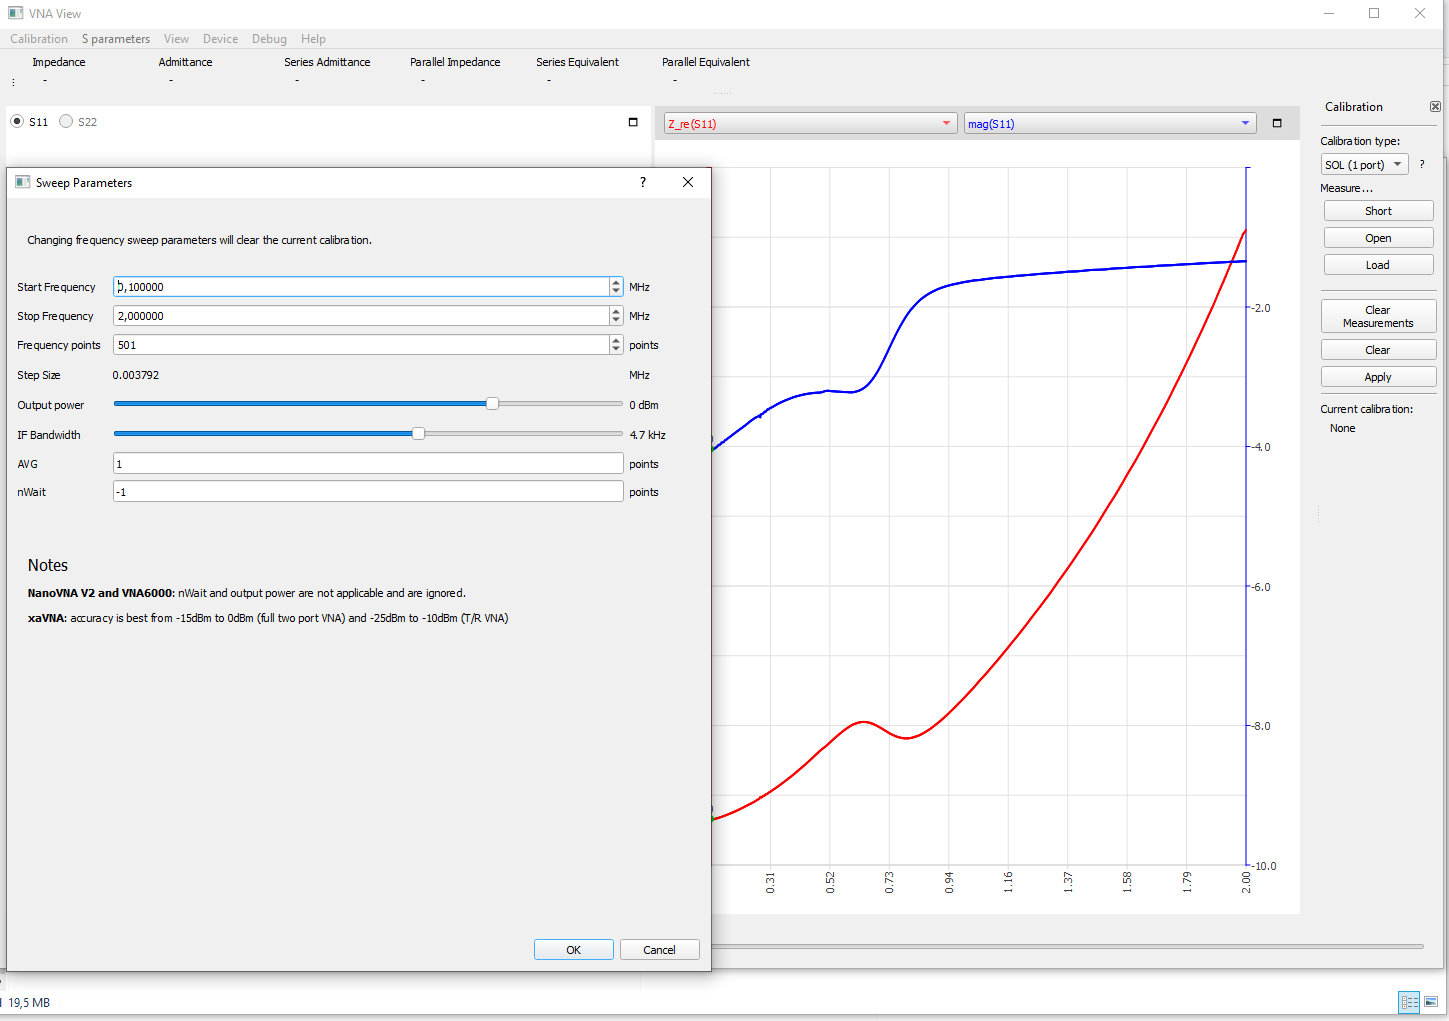
I'm using Matlab to capture continually the measurements of the MINI_VNA at a very low-frequency range(0,1-2MHz). I have noticed that the impedance curve has some spikes at certain frequency points with random magnitude. I used the NanoVNA Saver software to check the curves and I had the same problem, but surprisingly the problem does not appear in the VNA _QT software and the curve looks very smooth.
I tried different sampling points and increased the number of segments but this did not help. see the pictures attached.
Do have any idea how the VNA _QT software is configured and why the curve is very smooth?
what can be the problem source?
Best regards