Kurt Poulsen 2020/09/22 17:42
Hello Marco
Thank you very much for you analyzes I will try to test a T adaptor I have several some better than others 😊
As switching the enhanced function on and off can only be done with the barefoot SAA-2N and I have a set of homemade female N cal standards with rear flange calibration with know delays and it might be interesting to see how these behaves as well.
I envy you insight in these matters I will have to study your feed back in details to see if I can grasp how you are doing these analyzes
Kind regards
Kurt
Fra: NanoVNAV2@groups.io <NanoVNAV2@groups.io> På vegne af mce66
Sendt: 22. september 2020 15:53
Til: NanoVNAV2@groups.io
Emne: Re: [nanovnav2] Linear interpolation for calibration data on V2
Hello Kurt,
I attach 3 figures obtained from a quick analysis of your NanoVNA calibration data.
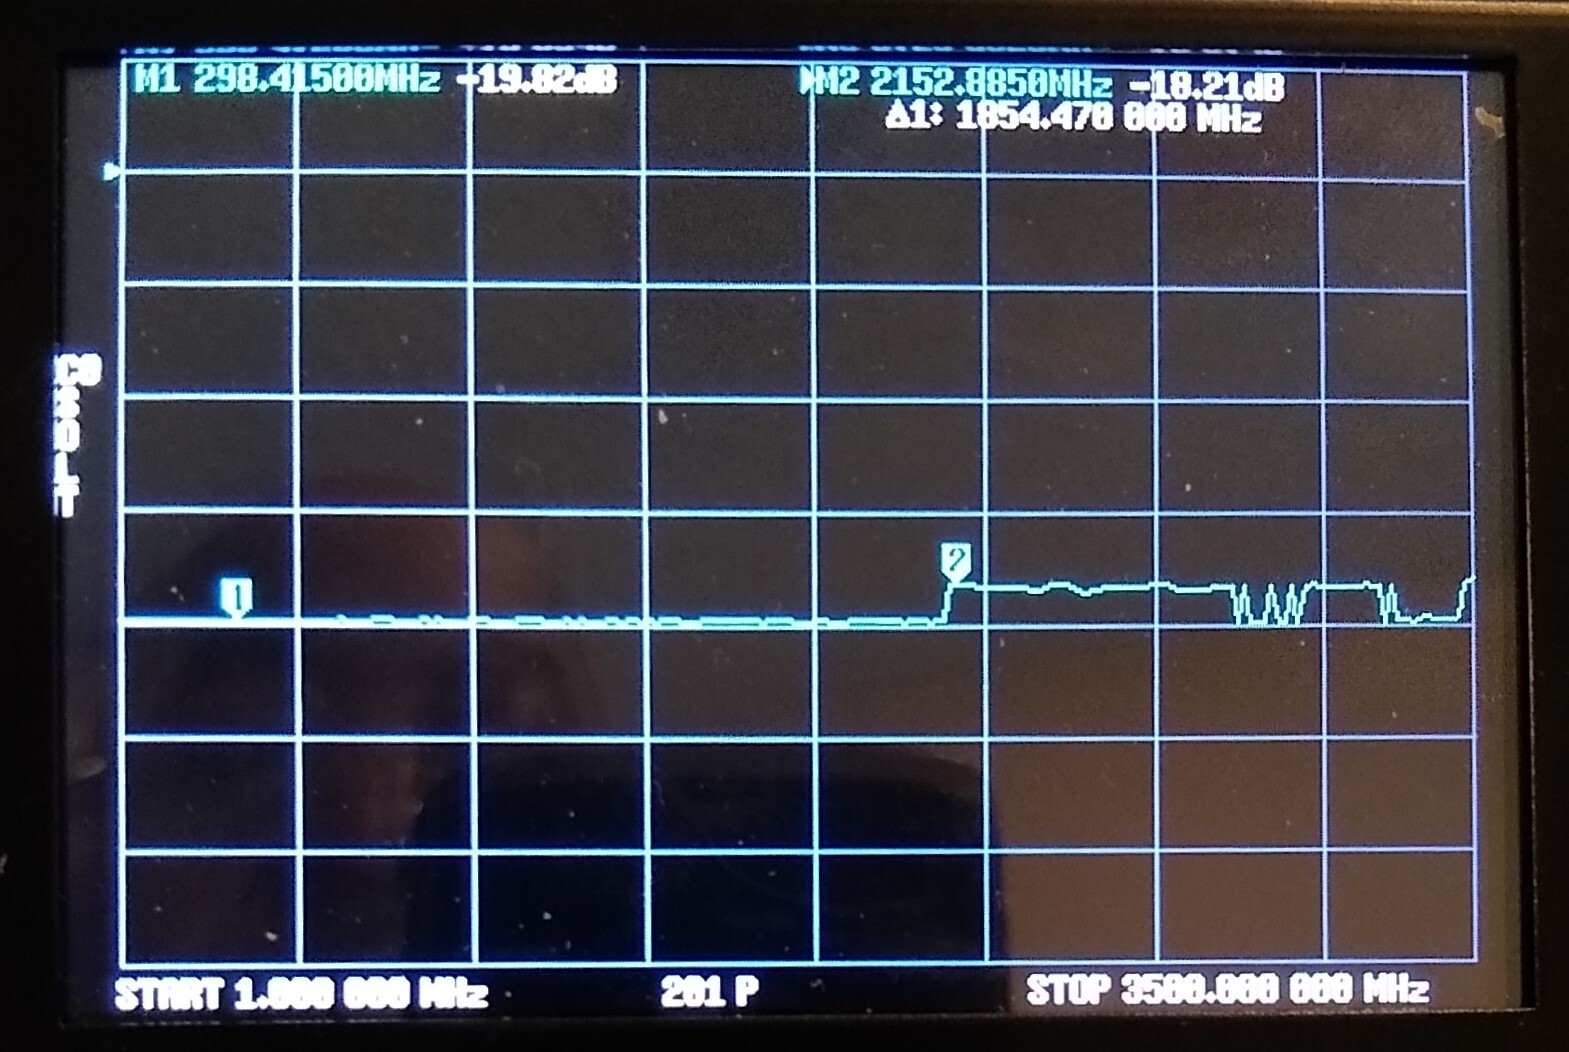
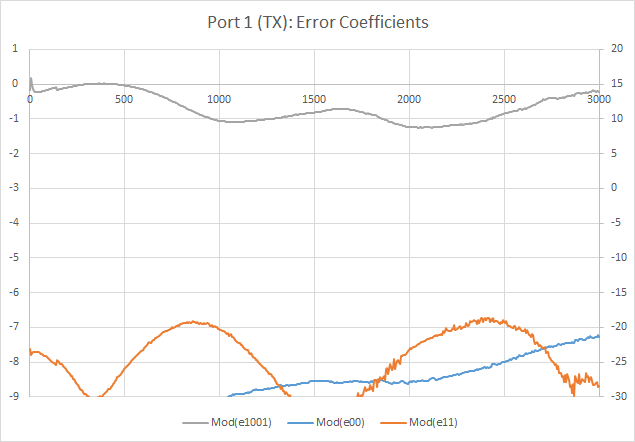
First picture shows the error coefficients of your port 1 (e00=directivity, e11=port 1 match, e1001=port 1 tracking). You can see that you HW is quite good, with a port 1 match that is between 20 and 30 dB RL (right scale, left scale is only for e1001)
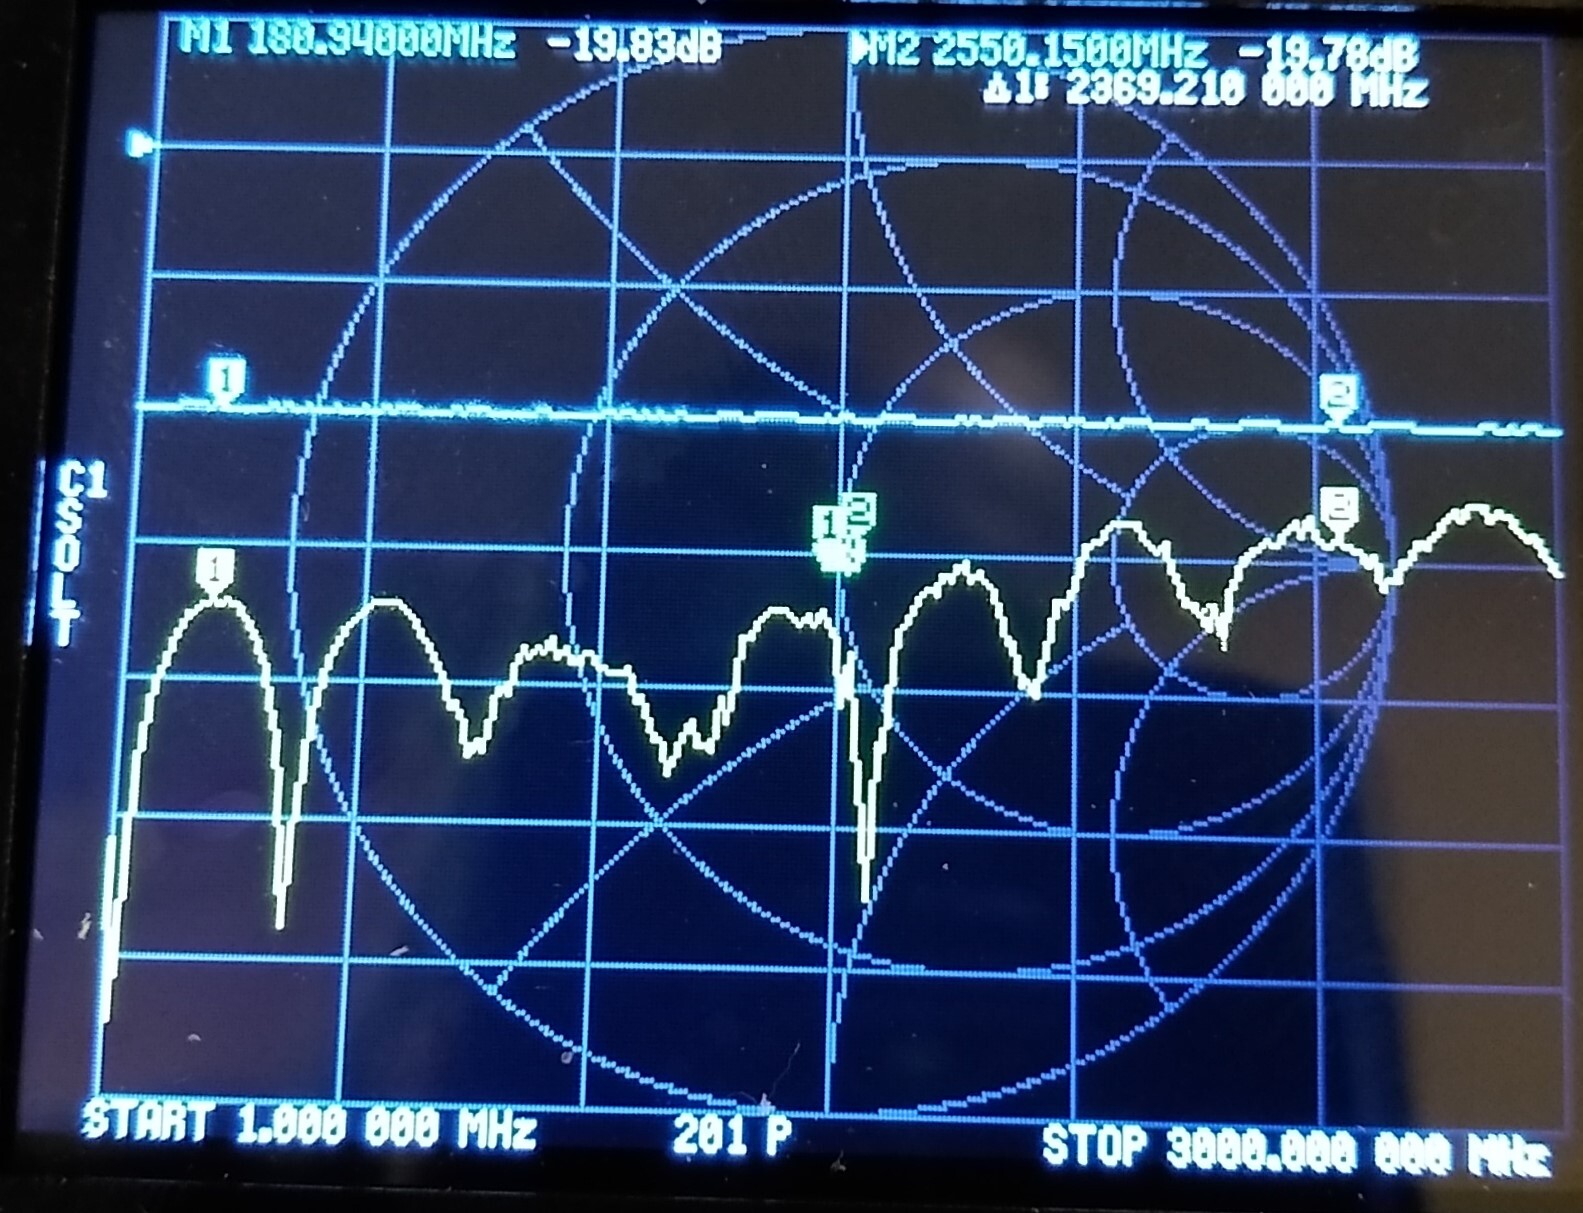
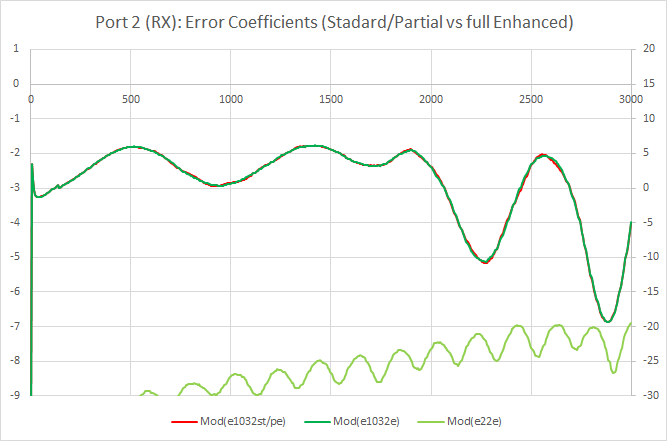
Second picture shows the error coefficients of your port 2+cable (e22=port 2 match, e1032=port 2 tracking). Also here, you can see that you HW is quite good, with a port 2 match that is below 25 dB RL at 1.5 GHz and about 20 dB RL at 3 GHz.
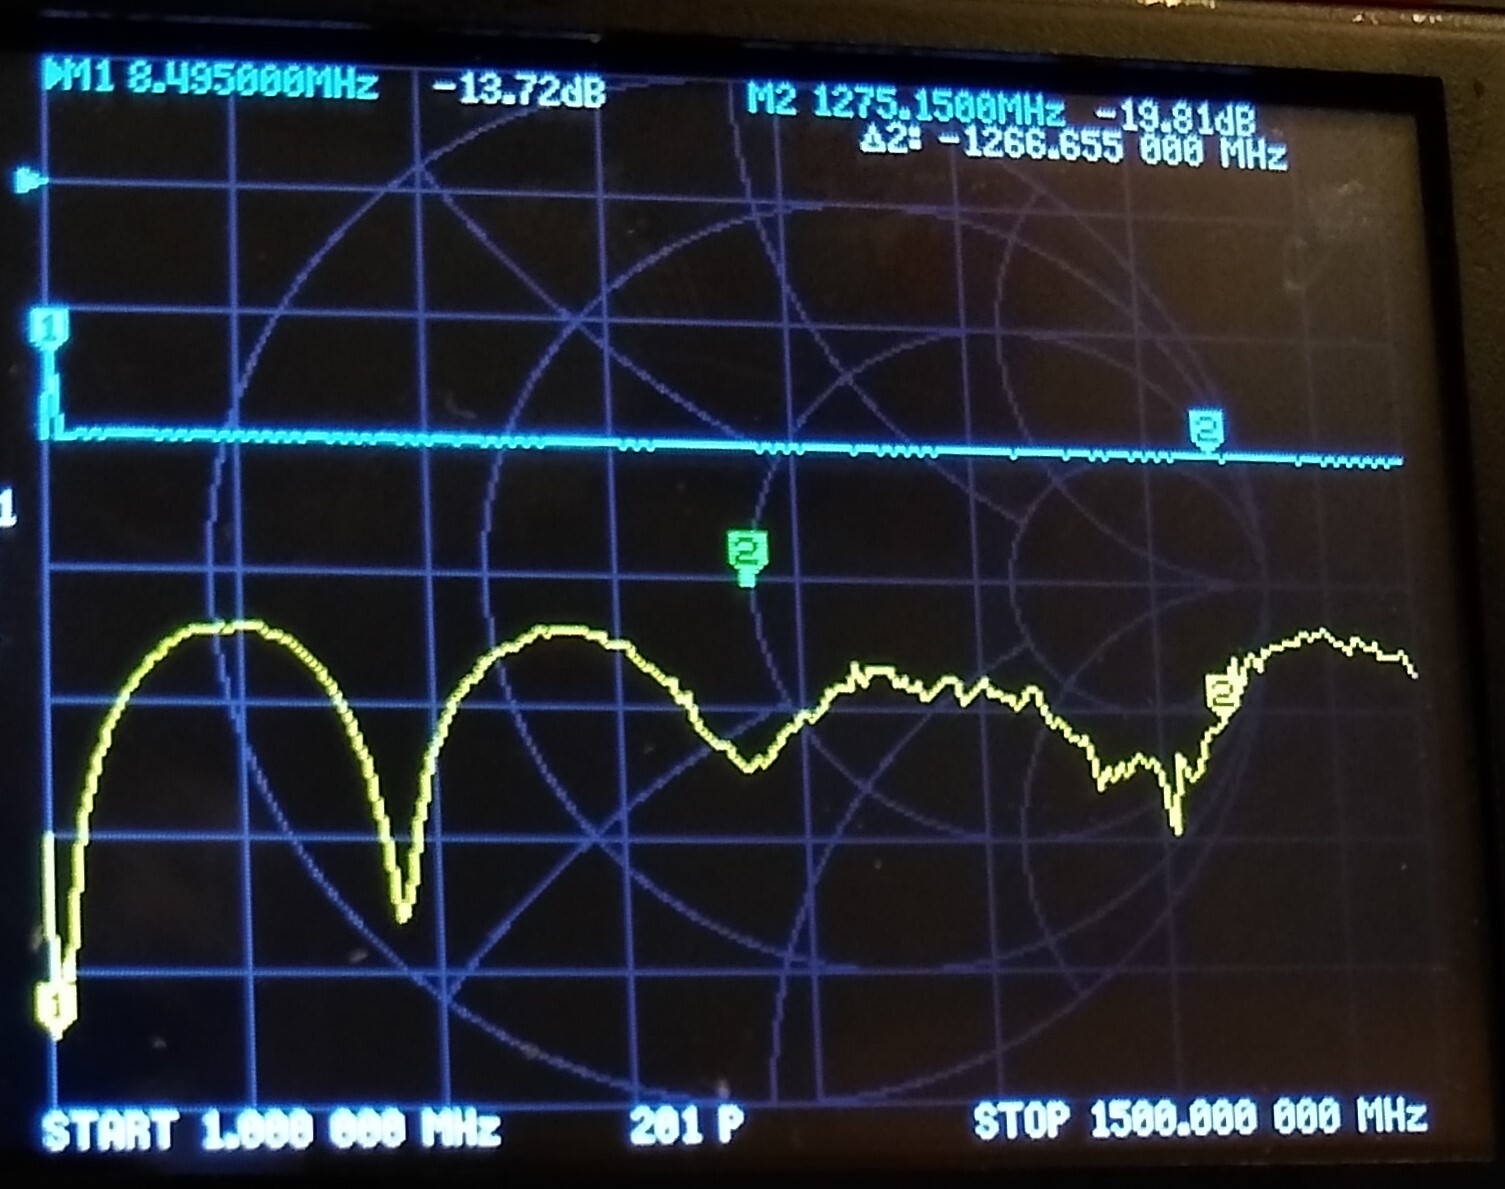
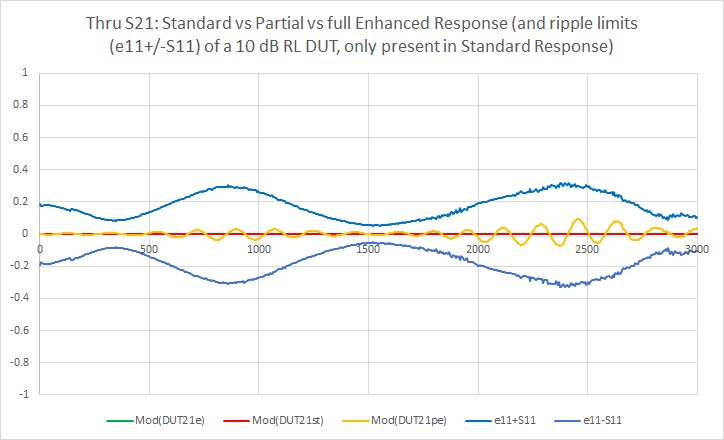
Third picture answers your question: "How do I see an impact from Enhanced Response?". Enhanced Response should eliminate two approximations, present in the Standard Response (and implemented in original NanoVNA FW):
1) neglect e22/e11 reflection during calibration of e1032 with THRU
2) neglect S11/e11 reflection during measurement of the S21 of a DUT
So far, latest FW (20200916) only solves approximation "2)" and then the approximation "1)" is still present.
Figure 3 shows in ORANGE the effect of approximation "1)" applied to your "good" HW. In practice you should have a residual ripple of up to +/-0.1 dB around 1 and 2.5 GHz. This approximation is always present since it is independent by DUT. As said, is not solved by latest FW.
Figure 3 finally shows in BLU the ripple limit that is expected in your HW due to approximation "2)". Since approximation "2)" depends on the S11 of the DUT, the figure assumes a DUT with an S11 of 10 dB (VSWR=2). This is,for example, the S11 of a T-Check (if you have one, you can try to measure it and see if the ripple on S21 is about +/- 0.3 dB at 1.5 and 2.5 GHz, as expected).This approximation "2)" is now solved by the Enhanced Response in latest FW, so enabling and disabling this feature should be an easy way to see the correction on S21 measurement in action. Again, this will be only visible with pretty mis-matched DUT and will not be visible with well matched DUT (like attenuators) for which S11 is about 0. At last, note that the period of this ripple will depend on the length of the cable between VNA TX port and DUT input port.
No, I do ot have SSA-2N or HP85032B/E...
Best regards, Marco.
