Anne Ranch 2023/08/17 10:51
Ultimately, it's up to someone putting in the (unpaid) time to make
improvements, and like all software like this - it kind of depends on if
the suggested change scratches an itch for the developer.
Judging from various encounters with "opinions" AND personal observations,
"nanoVNAServer " it is indeed an "old" , basically working ,
product of many contributors and currently its (product ) management
is lacking any resemblance of coordinated " what is the next step " or
"let's fix this issue".
Basically , as you pointed out - corrections and additions are up to
whomever is interested to "write code ".
On Wed, Aug 16, 2023 at 11:59 AM Jim Lux <jimlux@earthlink.net> wrote:
>
> On 8/15/23 1:40 PM, Leif M wrote:
> > First you can't copy version info clipboard. I hope I have the newest
> > version. I'm not going copy the version text here when it should go via
> > clipboard.
>
> NanoVNA Saver is python and uses the QT5 library. That should allow cut
> and paste.
>
>
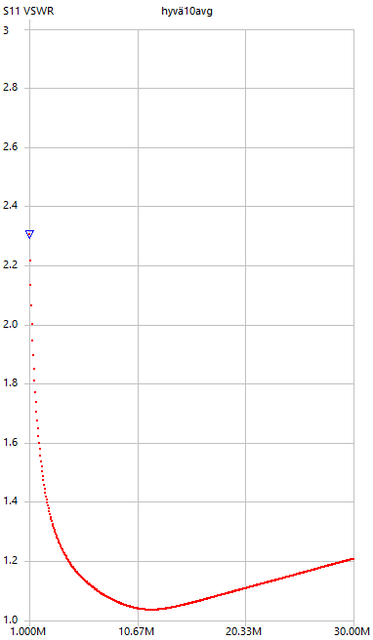
> > Wrong values in sweep control crashes the whole SW. I happened to
> > delete the MHz text from start frequency and got something strange into
> > the text box. I have difficulties putting or counting six or seven
> > zeroes in text boxes. So crashing SW is not nice.
> > Frequency scale in results is not nice. Exact frequencies are much
> > better than for instance 10.67MHz.
> There's a fair amount of code in routines like Frequency.py to try and
> autoscale the tick marks. It's kind of tricky, because Rune Broberg uses
> QT, but then you have to manage all the mouse events to do scaling and
> rubber banding of limits, etc.
>
>
> def drawFrequencyTicks(self, qp):
> fspan = self.fstop - self.fstart
> qp.setPen(self.textColor)
> qp.drawText(self.leftMargin - 20,
> self.topMargin + self.chartHeight + 15,
> Chart.shortenFrequency(self.fstart))
> ticks = math.floor(self.chartWidth / 100) # Number of ticks
> does not include the origin
> for i in range(ticks):
> x = self.leftMargin + round((i + 1) * self.chartWidth / ticks)
> if self.logarithmicX:
> fspan = math.log(self.fstop) - math.log(self.fstart)
> freq = round(math.exp(((i + 1) * fspan / ticks) +
> math.log(self.fstart)))
> else:
> freq = round(fspan / ticks * (i + 1) + self.fstart)
> qp.setPen(QtGui.QPen(self.foregroundColor))
> qp.drawLine(x, self.topMargin, x, self.topMargin +
> self.chartHeight + 5)
> qp.setPen(self.textColor)
> qp.drawText(x - 20,
> self.topMargin + self.chartHeight + 15,
> Chart.shortenFrequency(freq))
>
>
>
>
> >
> > There is plenty of datapoints now for a good looking graph, but joining
> > those dots would look nicer (whatever it is called in english)
> > By the way, every graph should have its own color.
> > This is Windows 64 and VNA is NanoVNA V2 Plus 4
>
> On my version (which is fairly old) each trace on a plot is a different
> color. So maybe there's something else going on.
> It might be that there's some forward/backward version issue with the
> graphics libraries. That is, the API hasn't changed in years, but what
> happens for various functions does evolve.
>
> I can't help on the "all rolled into one .exe" build - I manage my
> python config separately.
>
>
> Here's the code from chart.py - you can see that the colors are being
> set differently for various functions:
> sweepColor = QtCore.Qt.darkYellow
> secondarySweepColor = QtCore.Qt.darkMagenta
> referenceColor: QtGui.QColor = QtGui.QColor(QtCore.Qt.blue)
> referenceColor.setAlpha(64)
> secondaryReferenceColor: QtGui.QColor = QtGui.QColor(QtCore.Qt.blue)
> secondaryReferenceColor.setAlpha(64)
> backgroundColor: QtGui.QColor = QtGui.QColor(QtCore.Qt.white)
> foregroundColor: QtGui.QColor = QtGui.QColor(QtCore.Qt.lightGray)
> textColor: QtGui.QColor = QtGui.QColor(QtCore.Qt.black)
> swrColor: QtGui.QColor = QtGui.QColor(QtCore.Qt.red)
>
>
>
> Ultimately, it's up to someone putting in the (unpaid) time to make
> improvements, and like all software like this - it kind of depends on if
> the suggested change scratches an itch for the developer.
>
>
>
>
>
>
>
